Run a time report
Pick one of the six time reports, set its filters and read the results.
Who can do this: Everyone in the organization
The Reports page turns the time your team logs and the estimates on your tasks into six ready-made reports. Use them to see where the hours go, how well your team estimates and whether a sprint goes to plan. The reports cover the whole team, not only your own time.
Pick a report
- Choose Reports in the sidebar.
- Choose a report on the left.
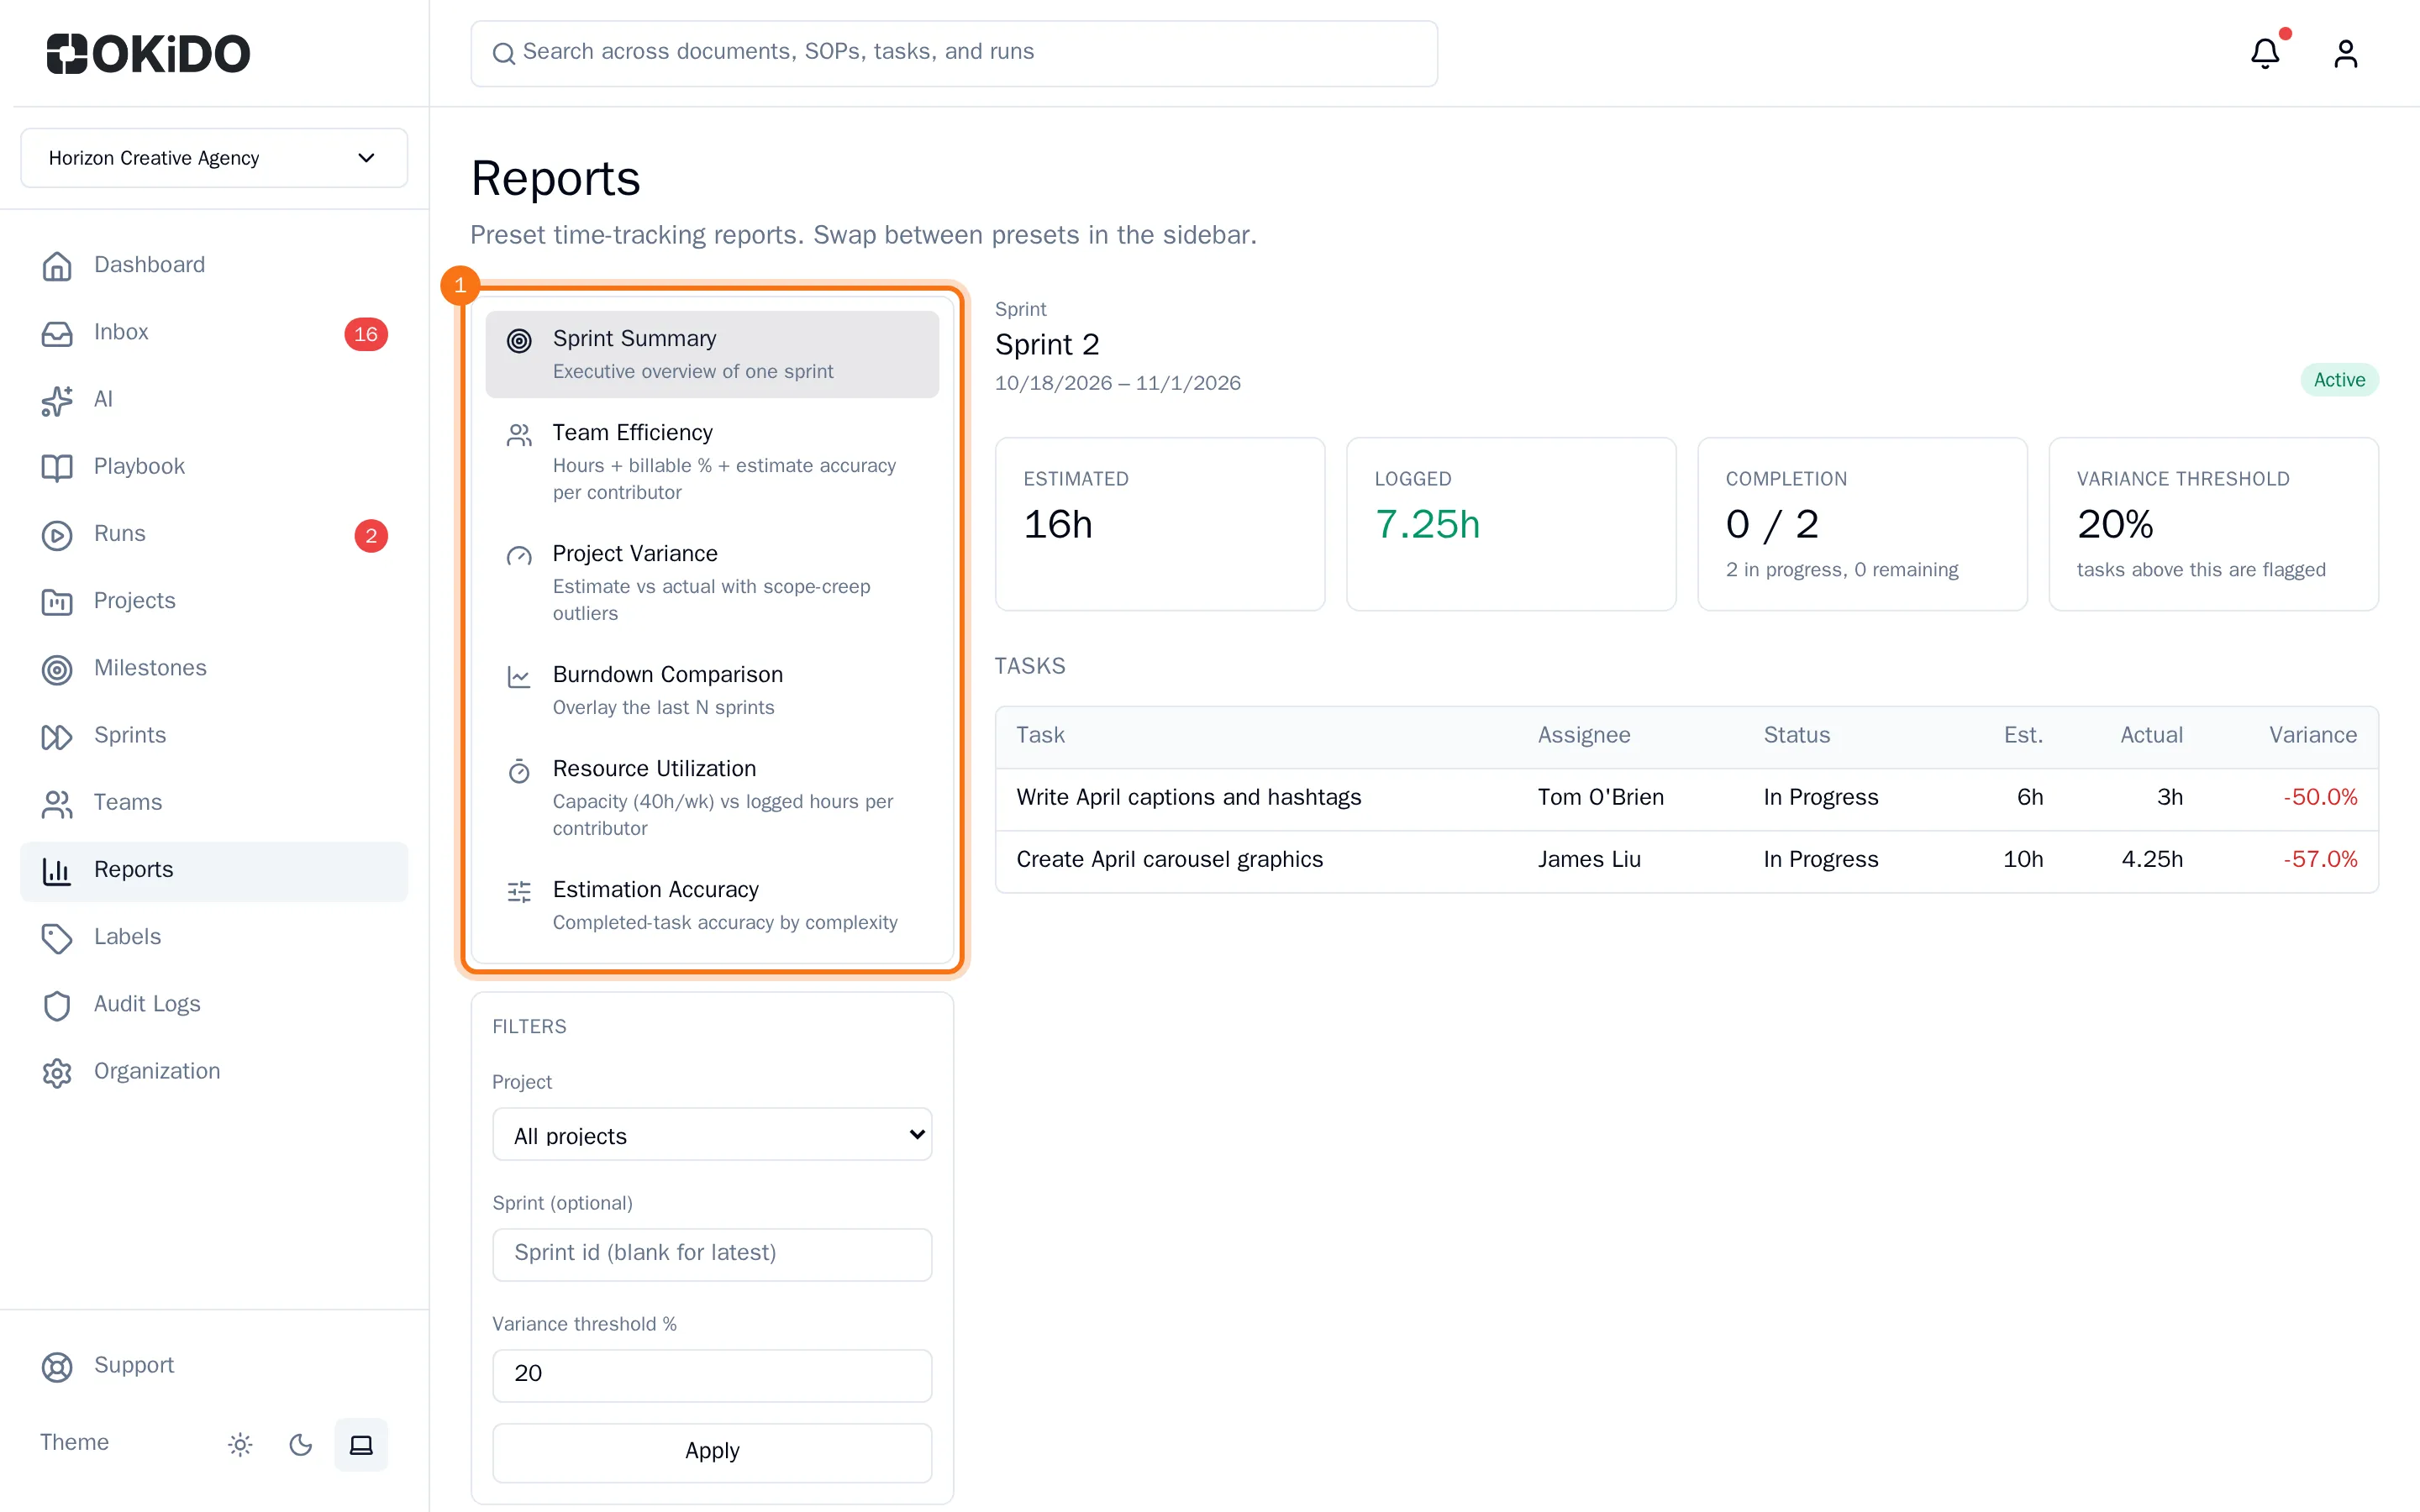
| Report | What it shows |
|---|---|
| Sprint Summary | One sprint at a glance: estimated and logged hours, how many tasks are done, and each task's estimate next to the time logged on it. |
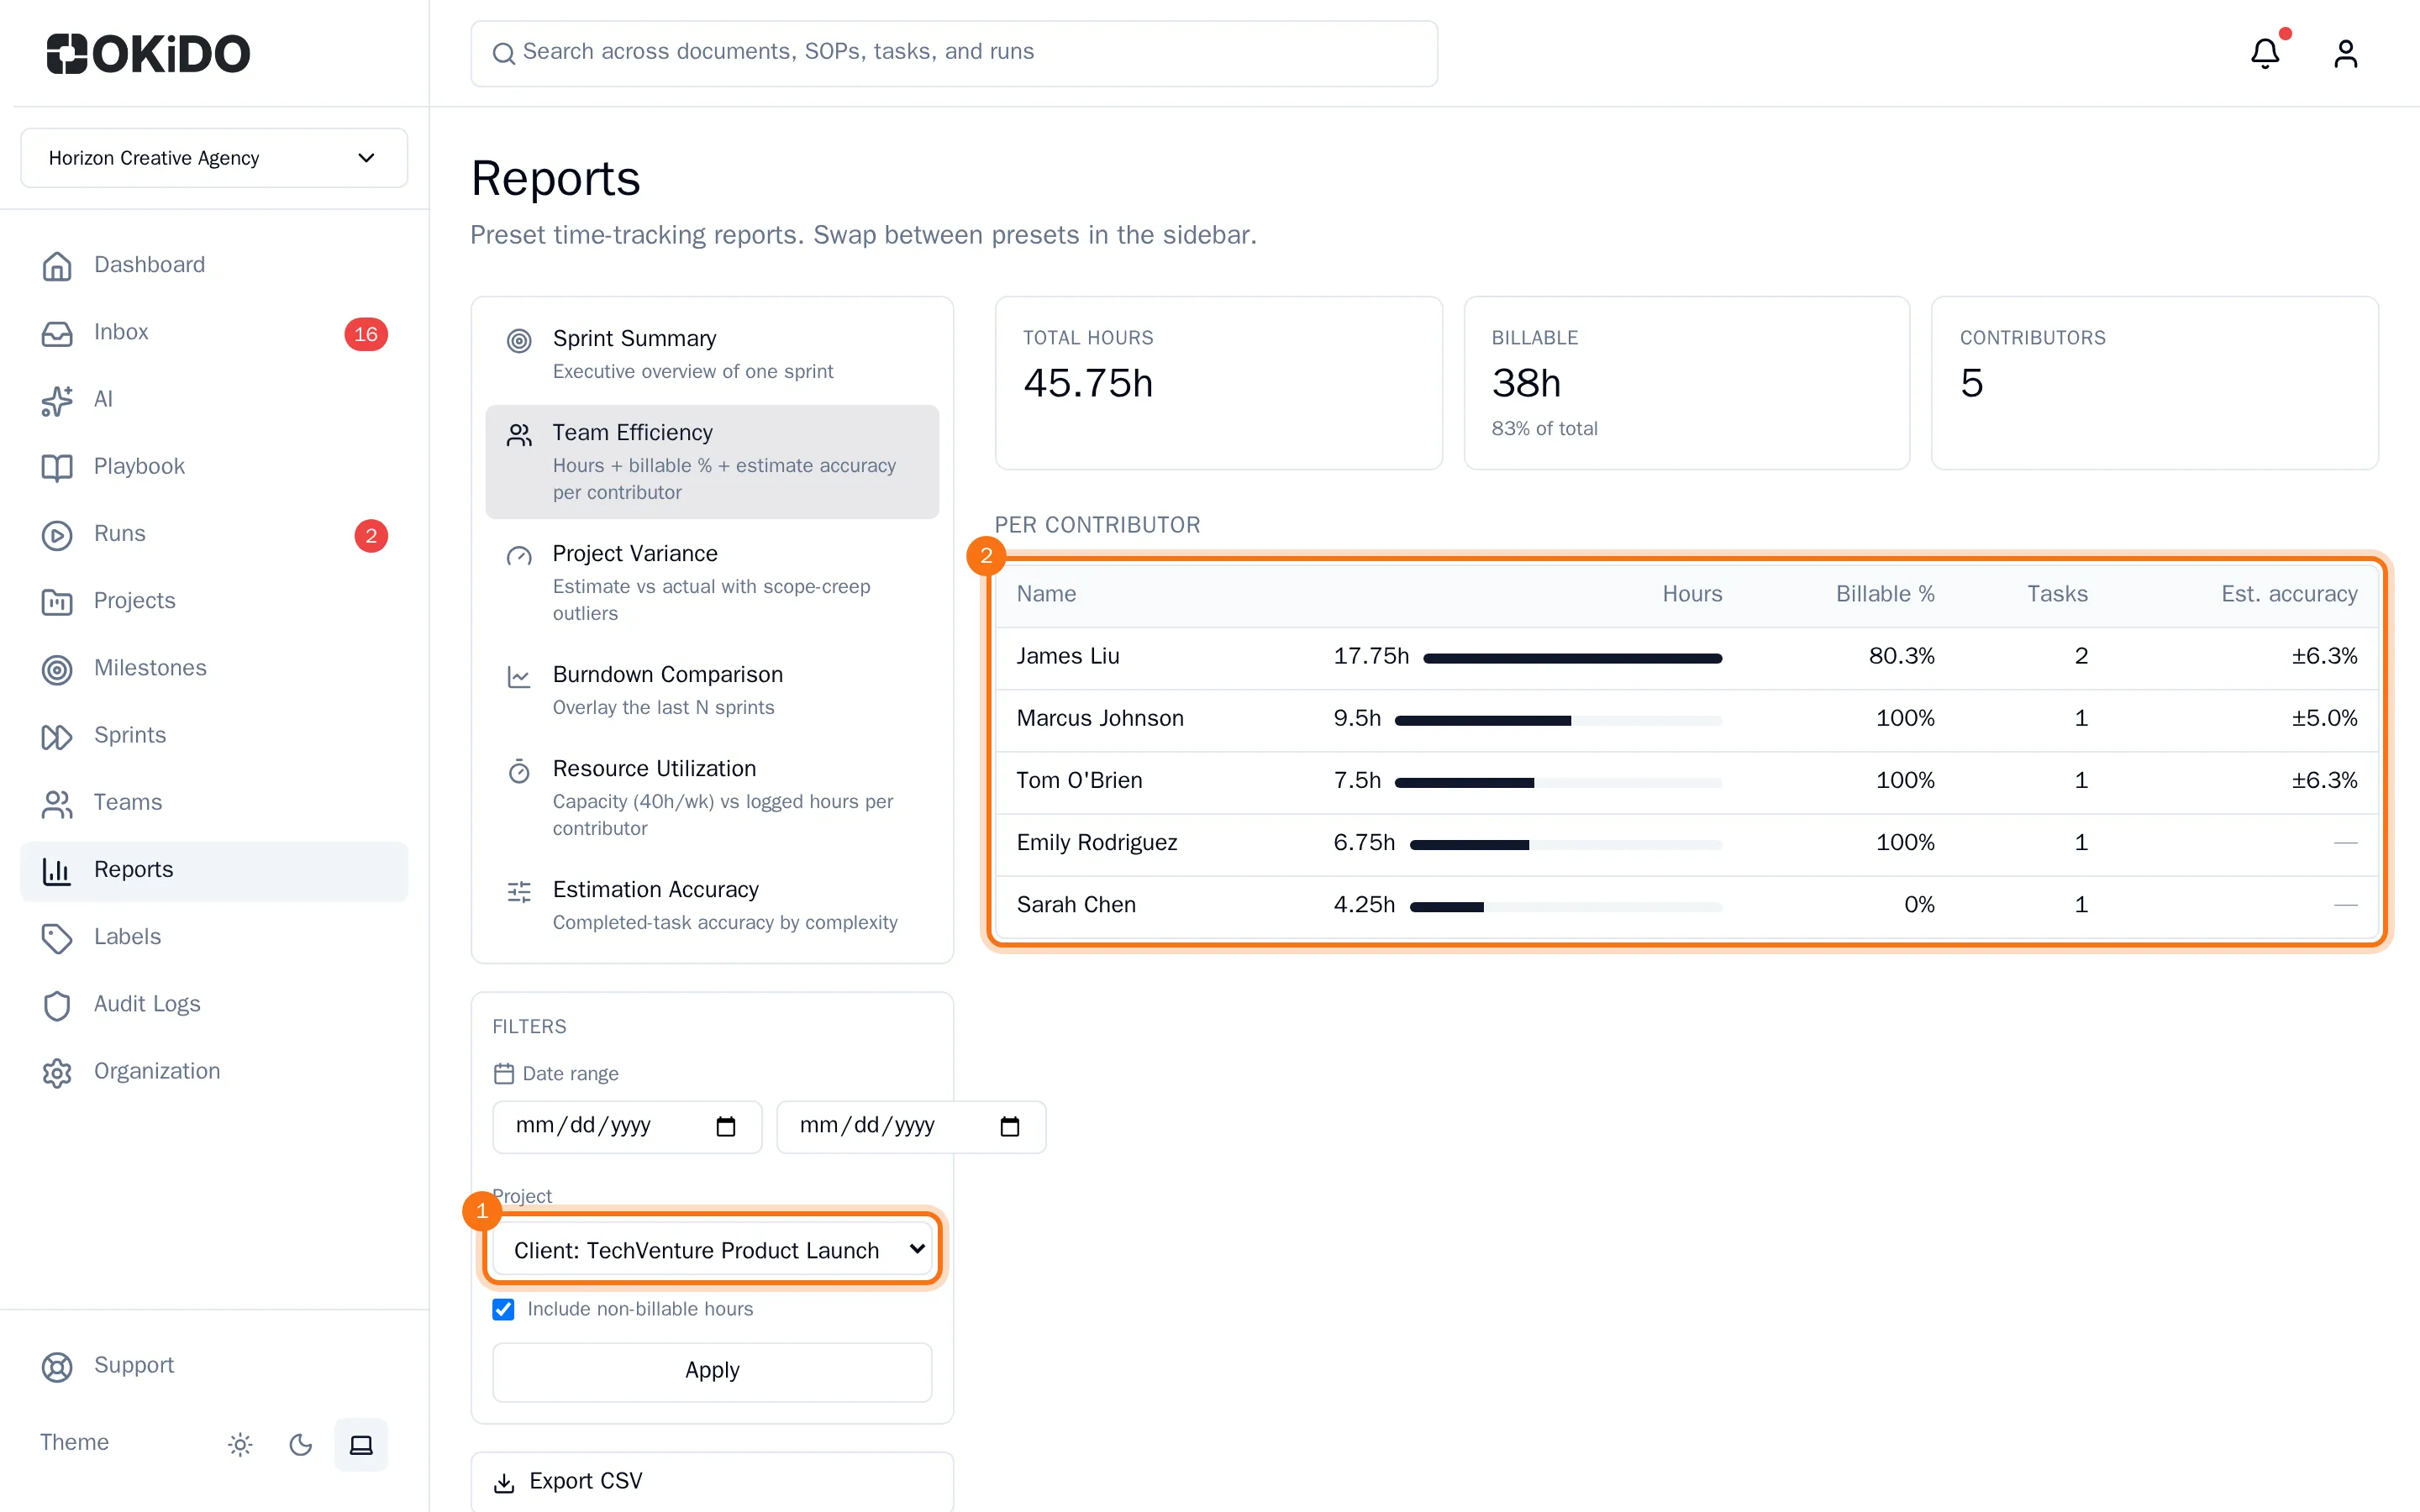
| Team Efficiency | Per person: hours logged, the billable share and how close their time came to the estimates. |
| Project Variance | Per project: estimated against actual hours, and the tasks that took more than 50% longer than estimated. |
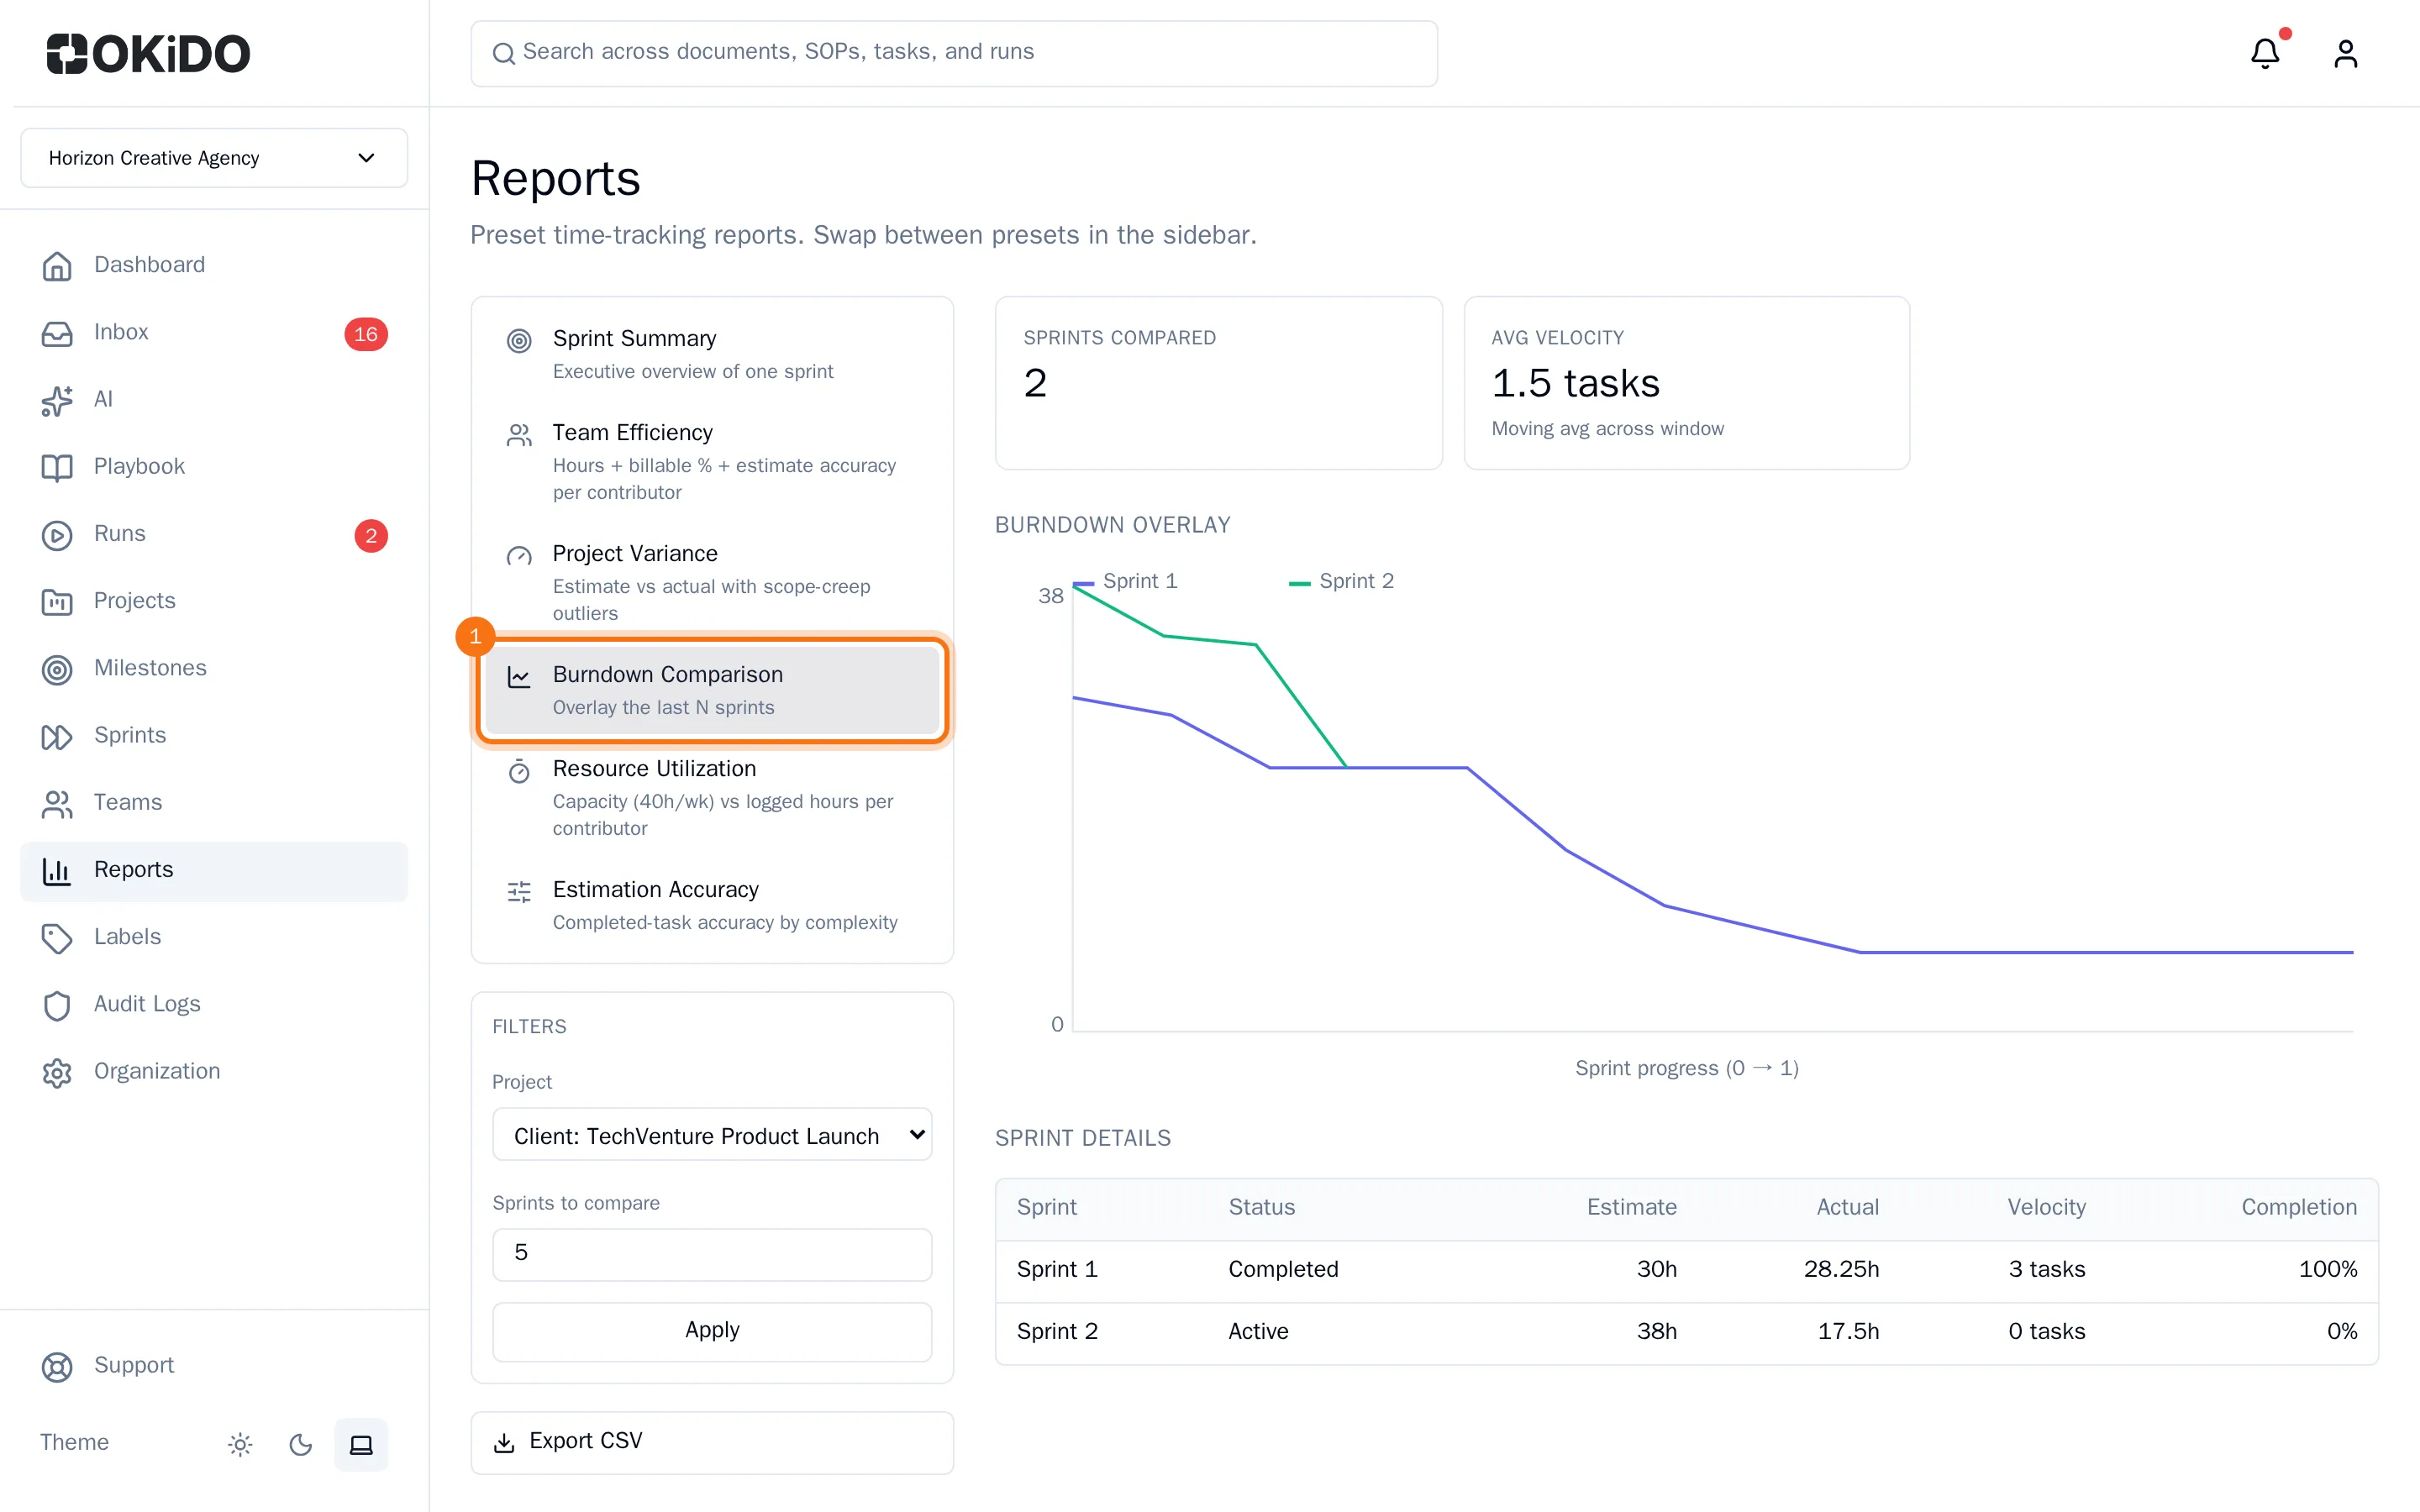
| Burndown Comparison | The burndown of your last sprints in one chart, with the velocity of each sprint. |
| Resource Utilization | Per person: hours logged against a capacity of 40 hours a week, with who has too much or too little work. |
| Estimation Accuracy | How close finished tasks came to their estimate, by task size, and whether your team tends to estimate too high or too low. |
Set the filters
Under the reports, each report shows only the filters it uses:
- Date range: the first and last day to include.
- Project: one project, or All projects.
- Sprints to compare: how many recent sprints the burndown compares, up to 10.
- Variance threshold %: how far a task may be off its estimate before it is flagged.
- Include non-billable hours: clear it to count billable hours only.
The report updates as soon as you change a filter. Choose Apply to build it again with the latest time entries.
The Sprint Summary shows the current sprint of the project you choose, or the last finished one when no sprint is running.
Read the results
Each report starts with its totals at the top, followed by a table. In Team Efficiency, for example, a higher estimate accuracy percentage means the time logged was further off the estimates. In Burndown Comparison, each line is one sprint: the steeper it falls, the faster that sprint's work was done.
To take a report into a spreadsheet, see Export a report to CSV.